Data Visualisation is in Our DNA
Be proactive and adapt quickly to changes

Make informed business decisions using visualization tools to summarize large quantities of data, understand trends, and predict future outcomes. Be proactive, save time, and measure your KPIs in real-time.
Data Visualization Tools
Pivot Tables
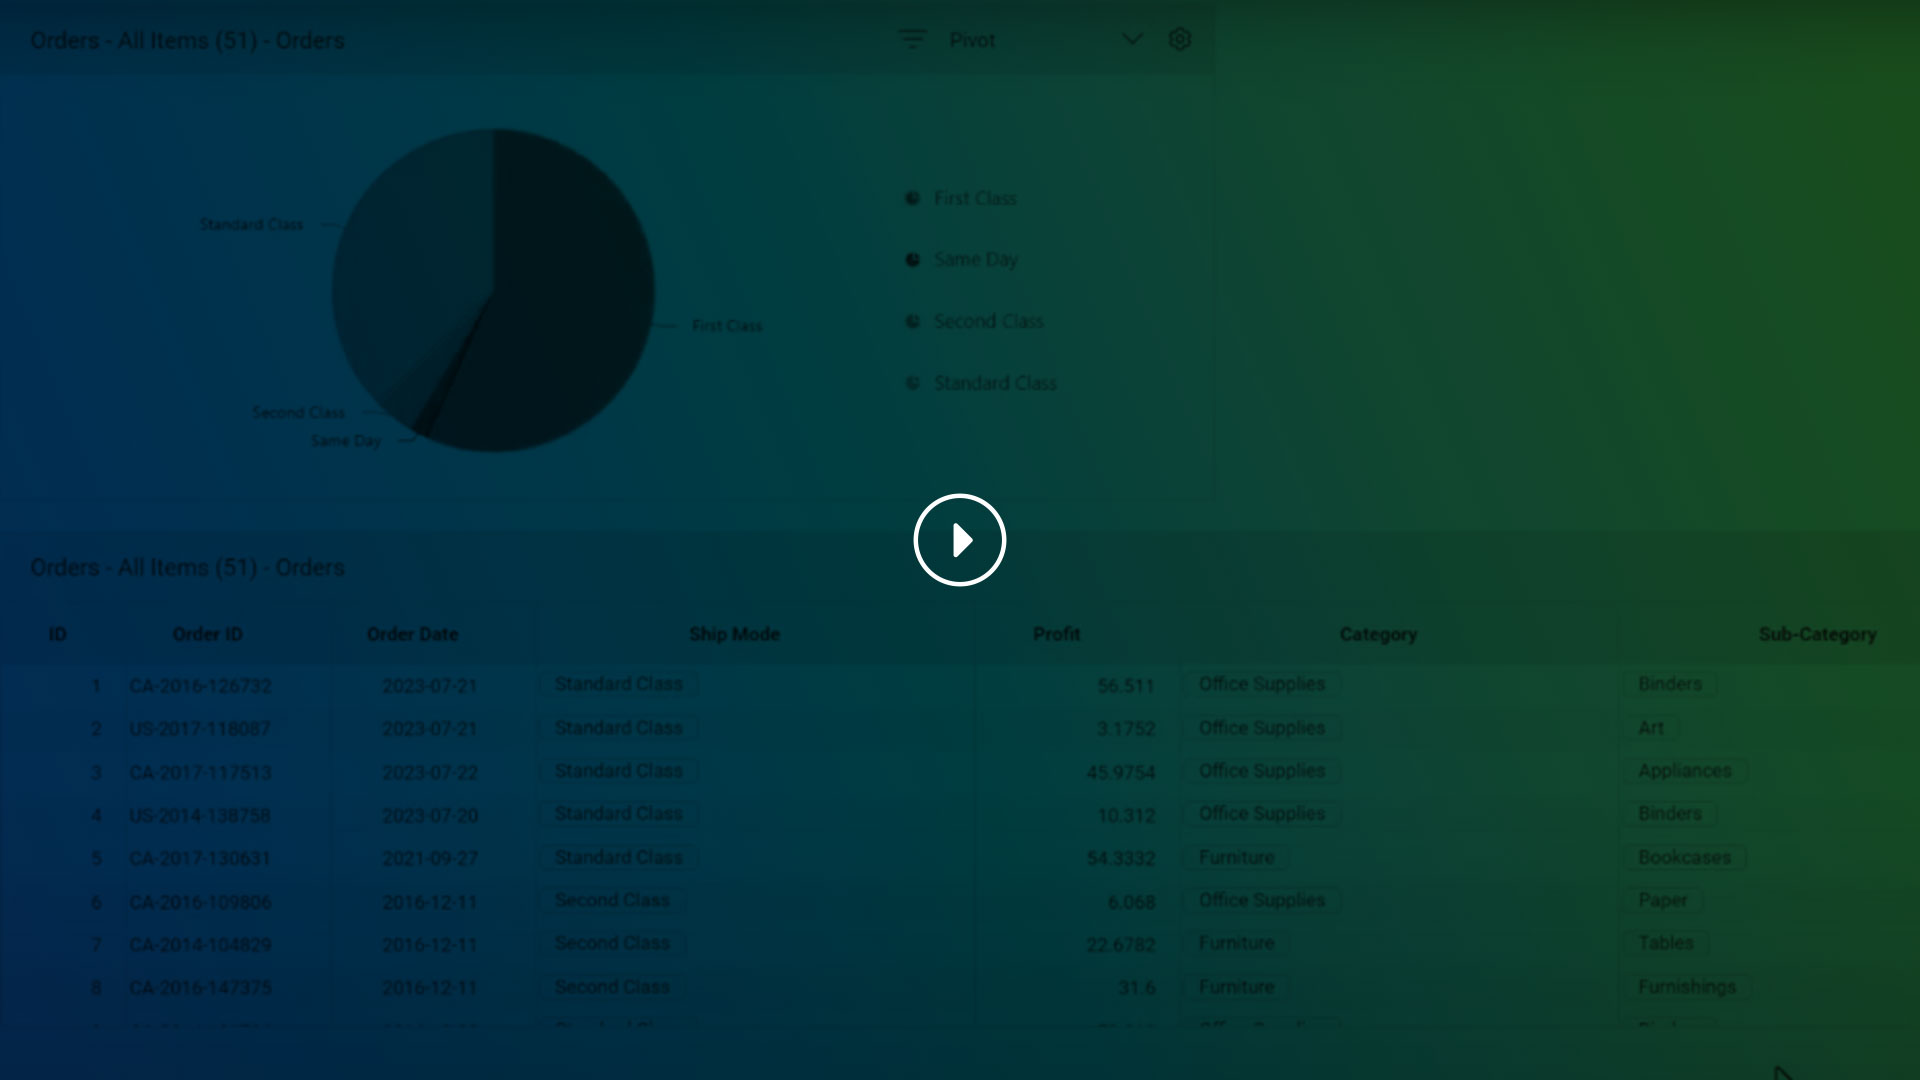
Pivot tables are a great example of a data visualization tool. They aggregate and categorize large quantities of data, providing valuable statistical insight. Kohezion’s pivot table is easy to use, allowing you to drag and drop data points, and customize visual elements. For example, get sums and averages from your data and export them to Excel.
Although any business can benefit from data analysis and visualization, the financial services sector leverages Kohezion’s pivot table for strategic planning. Comparing the number of hours billed monthly, quarterly, or annually with a growing client base brings excellent value to this sector. Aside from being a great visual analysis tool, pivot tables also allow teams to securely collaborate on projects by sharing their pivot table in Kohezion’s dashboard.
Pivot Table Features
- Aggregate large quantities of data
- Insert custom formulas and calculations within your pivot table ( Example: ("Sum(Order_Count)" + "Sum(In_Stock) )
- Customize formatting (make data fields and text appear in different colors)
- Share pivot table in the dashboard with other users
- Dynamically drag-and-drop data points
- Filter the search, data, and fields in the pivot table as you see fit
Group your data points ( month, quarter, year ) - Conditional formatting ( example: display in red if greater than 100 )
- Number formatting ( number, currency, etc )
- Export pivot table to a PDF, Excel, or CSV’

Charts & Graphs
Kohezion offers a wide range of charting options to suit all needs.
Line
Pie
Funnel
Pyramid
Column
Area
Bar
Step Area
Stacking Column
Stacking Area
Stacking Bar
Step Line
Pareto
Bubble
Scatter
Spline
Spline Area
100% Stacking Column
100% Stacking Bar
100% Stacking Area
Polar
Radar
Doughnut
When you are happy with the final product, export your chart to PDF or one of the following image formats: PNG, JPEG, SVG.
Bar Chart

Pie Chart

Line Chart

Calculations & Summarizations
This tool allows you for a wide range of calculations and summarization of your data.
- Sum
- Count
- Distinct Count
- Product
- Min
- Max
- Average
- Median
- Index
- Population Var
- Sample Var
- Population StDev
- Sample StDev
- Running Totals
- % of Grand Total
- % of Column Total
- % of Row Total
- % of Parent Column Total
- % of Parent Row Total
Geo Mapping Visualization


Who Uses Data Visualization Tools?
Really anyone in a given organization can benefit from this tool. The departments we tend to see using this tool more often are:
● Medical/healthcare
● Research
● Sales
● Marketing
● Customer Service
● IT
What Type of Data can be Visualized?
Pivot tables can be created with any type of structured data. Gain insight into your data quickly and easily.
Here are a few examples:
● Total hours billed in a month
● Number of appointments booked quarterly
● Breakdown of patients by age, gender, geography
● Experiments carried out compared to the previous month
● PPE inventory in stock broken down by type (masks, gloves, safety glasses etc.)
Your application prototype delivered in 2 weeks, at no cost
Let us build a prototype for your future business application. Go from an idea to an application prototype in under 2 weeks.


Try Kohezion for Free
Embrace low-code application development by bringing all of your data onto our platform. Kohezion empowers you to build a feature-rich custom online database application fast.
Popular Features
Do more with dozens of Features
Internal chat channels for secure collaboration - HIPAA compliant online forms - Dynamic PDFs - Simple Excel migration and download - Integrations with other software systems - Custom applications and workflows - Data-Based Searches - Secure Share and Subscribe to records - Smart pivot table - Automation - Reporting - and more ...