Businesses are increasingly reliant on data to make informed decisions. A recent study found that 89% of executives believe high data quality is crucial for their organization's success.
One powerful tool for achieving this is having a single source of truth in the form of a core app dashboard. This article will guide you through the process of building a robust system dashboard tailored to your business needs, ensuring accurate and reliable information for effective decision-making.

What is the Core App Dashboard?
A core app dashboard is a centralized system dashboard that enables businesses to gather data from multiple sources and present it in a single location. Think of it as a customizable home screen that displays the most relevant information to businesses. It provides single-touch access to all the apps in one convenient location, allowing businesses to personalize every part of their app drawer.
Simply put, it is a dashboard for all businesses' core apps. This is where all departments can use a single-source tool to build dashboards for all essential applications. It lets businesses manage their apps effectively, monitor app-related data, and optimize their performances while keeping them up-to-date with the latest firmware and security updates.
Why is Having a Core App Dashboard Important?
A core app dashboard is a central interface that provides a snapshot of essential information and tools, streamlines access to key features, data, and functionalities, and facilitates efficient navigation and decision-making within an application.
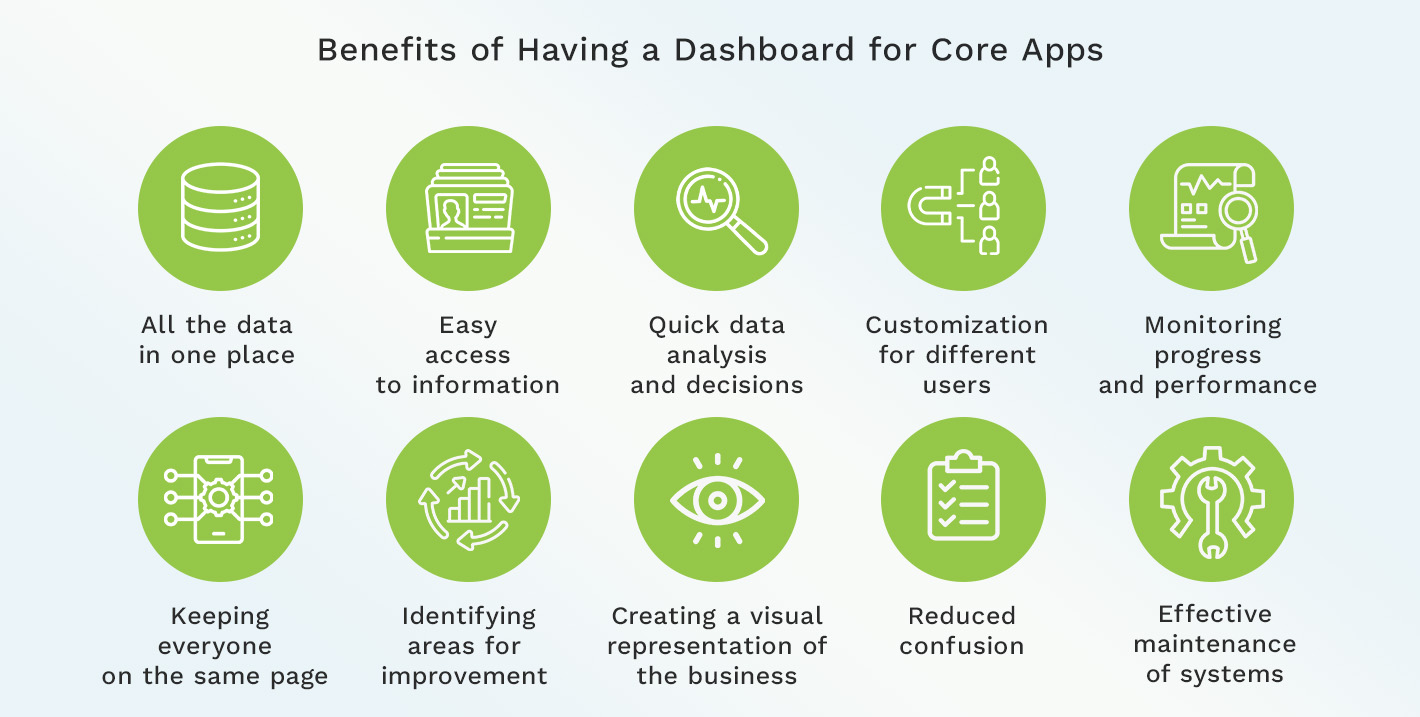
Benefits of Having a Dashboard for Core Apps
Let's explore some key advantages of integrating a core app dashboard into your business strategy.
1. All the data in one place
As a central hub that allows users to manage their core apps, this customizable home screen displays all the relevant information in one place. The main advantage of having all the data in one place is improved data accuracy, which means less chance of data duplication or errors.
Another advantage is reduced time spent on data collection, as users don't have to manually collect data from different sources. Having all data in one place also facilitates easier analysis.
2. Easy access to information
Easy access to information is essential for any organization to make educated decisions and maintain market competitiveness. The dashboard gathers all pertinent data in one location, making it easily accessible.
It saves time and improves decision-making, productivity, collaboration, and customer satisfaction.
3. Quick data analysis and decisions
To remain competitive, businesses must quickly analyze data and reach informed judgments in today's data-driven environment. The dashboard, which consists of core apps, is an ideal tool for this purpose, as it offers several benefits for quick data analysis.
Some of the benefits of having such a dashboard include real-time data updates, customizable charts and graphs, and drill-down capabilities
4. Customization for different users
Customization is a key feature that allows users to tailor their dashboard to their specific requirements. This is especially important for businesses, as different users have different roles and responsibilities, requiring different information to be displayed on the dashboard.
Some ways in which customization can benefit businesses include improved productivity, increased visibility, better decision-making, improved collaboration, and flexibility.
5. Monitoring progress and performance
Any company must keep track of its progress to spot trends, patterns, and potential improvement areas. Progress tracking becomes easy and efficient with the help of a dashboard that integrates all the core applications.
Some specific benefits of using such a dashboard for progress tracking include identifying trends and patterns, tracking KPIs, providing insights into performance over time, and customization options.
6. Keeping everyone on the same page
As a home page, your dashboard provides an overview of key performance indicators, business metrics, and actionable items in configurable widgets. It ensures everyone is on the same page.
Its goal is to give users all the information they require about their projects, businesses, workers, and clients. The items are prioritized, while the elements are displayed according to each user's position within the organization.
7. Identifying areas for improvement
Companies use dashboards to monitor their performance and spot areas for development. Real-time insights on important variables like sales, customer happiness, and employee efficiency are available to businesses.
Users can monitor different metrics, including accounts receivable (AR), cash flow, project performance, time and expense tracking, profit and loss, customer satisfaction, and employee productivity.
Businesses can monitor these data and spot places where they are falling short of their objectives or where there are process bottlenecks. For example, if the dashboard indicates that staff productivity has fallen, the company can look into the reason why and take appropriate action.
8. Creating a visual representation of the business
A company dashboard provides a comprehensive overview of key performance indicators, business metrics, and actionable items in configurable widgets. That can make it easier to understand and analyze data.
A dashboard prioritizes all items, provides critical analysis, helps to identify the best performers, displays financial data, and provides a visual representation of data.
9. Reduced confusion
Confusion can seriously hamper the ability to operate efficiently. It may result in misunderstandings, holdups, and mistakes, ultimately reducing the organization's effectiveness. A centralized system dashboard can reduce confusion in your business and provide clear data visualization, real-time updates, and customizable views.
10. Effective maintenance of systems
The centralized dashboard provides real-time monitoring of all your apps, allowing you to quickly identify any issues that may arise. For example, the dashboard will immediately alert you if your website crashes.
If you have multiple apps that require different login credentials, the dashboard allows you to store all the credentials in one place. It also provides customizable alerts that notify you when specific events occur.
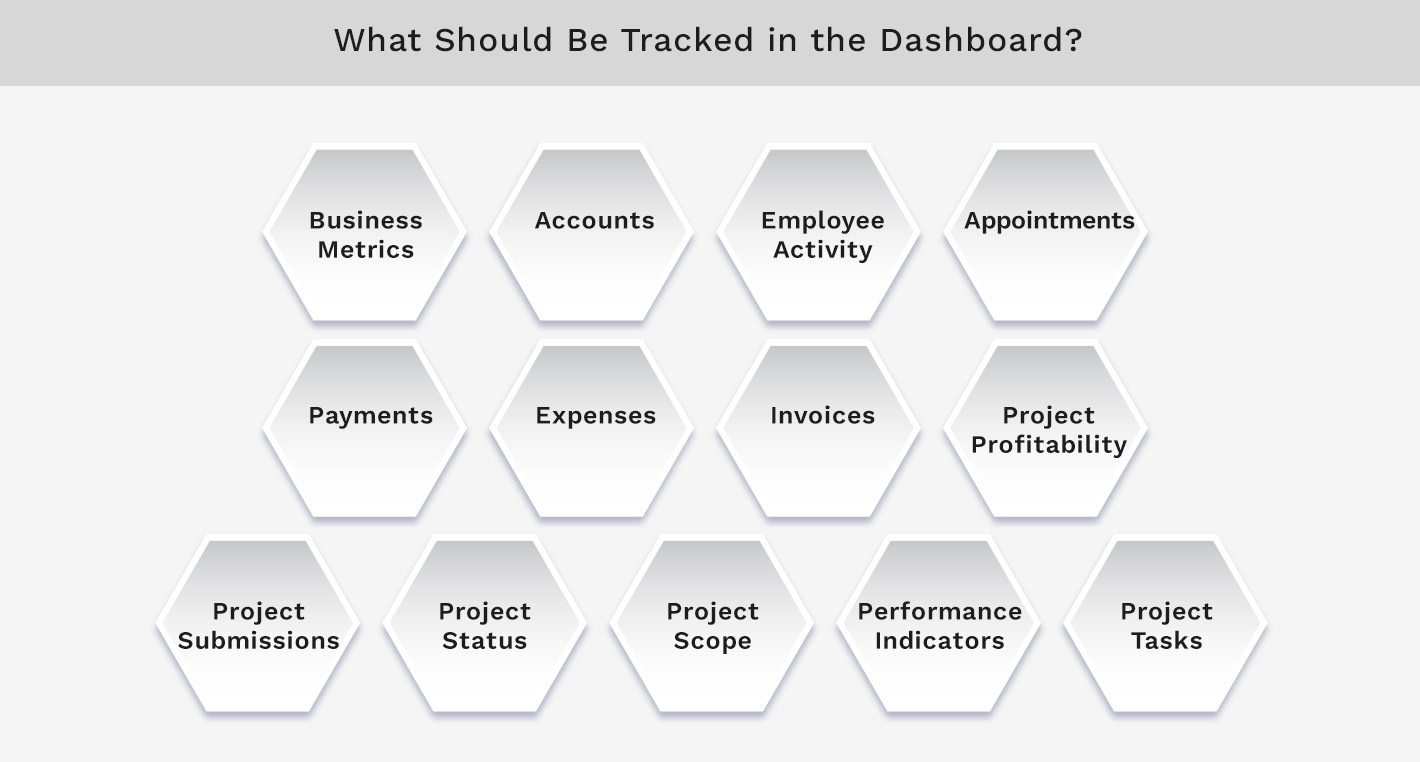
What Should Be Tracked in the Dashboard?
Knowing what to track in your dashboard is crucial for its effectiveness. Here are the key metrics and data points that should be included to provide valuable insights for your business.
1. Business Metrics
Tracking these metrics in a single source of truth system dashboard can provide valuable insights into the company's operations. Listed below are some essential business metrics that can be tracked:
- Revenue: This indicator shows the business's total revenue over a given time frame. It is a crucial performance indicator that may be used to spot patterns and project future growth.
- Customer Acquisition Cost (CAC): CAC is the cost that the company incurres to acquire a new customer. It includes all marketing and sales expenses and is an important metric for evaluating the effectiveness of the company's sales and marketing strategies.
- Customer Lifetime Value (CLV): CLV is the total revenue a customer is expected to generate for the company over their lifetime. It allows you to better understand each customer's value. Many companies use it when making decisions regarding customer retention and acquisition.
- Conversion Rate: This metric calculates the proportion of website visitors who engage in a certain action, like completing a purchase or submitting a form. It is a crucial indicator for assessing the website's and marketing initiatives' success.
- Churn Rate: The churn rate represents the percentage of customers who stop using the products or services over a given period.
2. Accounts
The following are the types of accounts that you should track in the dashboard:
- Customer accounts: Any company needs customer accounts because they serve as sources of income. The dashboard allows you to track account balances, payment history, and contact details.
- Vendor accounts: They represent expenses incurred by the business. Track account balances, payment history, and contact information in the dashboard.
- Employee accounts: These are necessary for managing payroll and benefits. In the dashboard, you can track employee information such as contact details, salary, and benefits.
3. Employee Activity
Include an unordered list of the different widgets available in the app that can track employee activity, such as time and expense user (timekeeper), project manager, billing user (accountant or biller), and principal/partner (owner of the company).
Describe each category in detail, highlighting the different metrics and methods used to track key information.
4. Appointments
Every organization must track appointment metrics, which are critical to successful business management. Some crucial parameters for appointments that need to be monitored include the number of appointments scheduled, the number of no-shows, the average time to schedule an appointment, and the average duration of appointments.
Find areas for improvement, streamline appointment scheduling procedures, and monitor these KPIs. For example, a high percentage of no-shows may lead to lost revenue opportunities and resource waste. On the other hand, a protracted wait time for making appointments can result in irate clients and diminished sales.
5. Payments
There are a few payment metrics that you need to track in the dashboard, including total revenue, average transaction value, payment method breakdown, and chargeback rate. Let's shed some light on each of them:
- Total revenue is an important metric that provides an overview of a business's financial performance. Businesses can monitor revenue over time, spot trends, and decide on pricing, promotions, and marketing tactics.
- Average transaction value is another key metric to track as it provides insight into customer behavior. Businesses use this data to optimize pricing strategies and find cross-selling and up-selling opportunities.
- A breakdown of payment methods helps businesses understand how their customers prefer to pay. Businesses can accept the most common payment methods by optimizing the checkout process and using this information.
- The chargeback rate measures the number of disputed transactions. High chargeback rates can indicate issues with fraud or customer dissatisfaction.
6. Expenses
Expenses that you should track in the dashboard include:
- Accounts Receivable: This widget shows the month-to-month accounts receivable balances for the previous 12 months and unpaid invoices divided into defined periods depending on the invoice date or the due date within the given date range.
- Cash Flow: It shows all cash payments received including retainer payments, but broken into defined periods within the specified date range.
- Billing: It shows all the billing done by the company without considering the retainer amount used, broken into defined periods within the specified date range.
7. Invoices
The following are the two most common metrics that are tracked for invoices on the dashboard:
- Number of Invoices Paid on Time: This measure records the ratio of timely paid invoices to those paid after the due date. It can assist organizations in identifying clients who routinely make payments later and take the necessary steps to lessen the impact on their cash flow.
- Average Time to Payment: This metric captures the average time it takes to pay an invoice. Businesses that use it can identify their invoicing process's bottlenecks and take action to make it more efficient, resulting in quicker payments and better cash flow.
Besides these metrics, the invoices component should offer several customization options, such as the ability to filter by date range, customer, and payment status. The more metrics, the better.
8. Project Profitability
To track project profitability in your dashboard, consider the following key metrics:
- Project Revenue
- Project Expenses (labor, materials, and any other expenses incurred)
- Profit Margin: To calculate the profit margin, divide the profit by the revenue and multiply by 100.
- Return on Investment (ROI) measures the profit generated in relation to the initial investment in a project. To calculate ROI, divide the profit by the initial investment and multiply by 100.
Each of these metrics plays a role in determining project profitability. If project expenses are high, it could indicate inefficiencies that must be addressed. Profit margin and ROI provide insight into the overall success of the project.
9. Project Submissions
Here are the key components that should be included in the project submissions section of your dashboard:
- Project Name: Make sure it's clearly displayed, as well as any relevant information, such as the project owner and deadline.
- Project Status: This could include whether the project is in progress, completed, or on hold.
- Assigned Team Members: List the people assigned to each project and their roles and responsibilities.
- Project Description: A brief description of the project outlining its goals needs to be included.
- Project Timeline: Establish it for each project, outlining key milestones and deadlines.
- Project Budget: Make sure it's clearly defined, including any resources or materials needed for completion.
- Project Feedback: Feedback in the dashboard allows team members to review and address any problems that arise
10. Project Status
Effective decision-making requires accurate and up-to-date information on the status of ongoing projects. That being said, be sure to cover the following key points:
- The Project Status section lists all ongoing company projects. This lets users quickly identify which projects are on track and which may require additional attention.
- Each project is color-coded based on its status. That makes it easy to identify projects that are behind schedule or at risk of missing deadlines.
- The Project Status section displays key metrics for each project, such as budget, timeline, and resource allocation. This lets users quickly identify any areas requiring additional resources or attention.
- The users drill down into each project to view more detailed information, such as task lists, timelines, and resource allocations. Thus, they can identify specific tasks or resources that may be causing delays or issues.
- The users create and track milestones for each project. This provides a clear roadmap for each project.
11. Project Scope
A well-defined project scope can make sure the dashboard displays relevant information that aligns with your business goals. Here are the key metrics and KPIs that you should track:
- Accounts Receivable - This widget displays the total amount of money owed to your company by clients and customers.
- Cash Flow shows the cash generated in the company on a monthly basis for the last 12 months.
- Billing - It represents the total billed amount every month for the last 12 months.
- Aging - The age of your accounts receivable indicates how long it has been since the invoice was issued.
- Employee Performance - It must include your employees' productivity, attendance, and other key metrics.
- Customer Satisfaction - This represents the satisfaction level of your customers based on feedback and reviews.
12. Performance Indicators
Tracking performance metrics is essential for organizations to make educated decisions. The dashboard needs to display several performance metrics to gauge business performance.
These metrics include revenue growth, client acquisition cost, customer retention rate, NPS, employee engagement, and website traffic. Periodically monitoring and analyzing key performance indicators is crucial to guaranteeing the firm's success.
13. Project Tasks
Last but not least, your dashboard should provide a comprehensive solution for tracking project tasks to help you make sure projects are completed on time. Here are some of the project tasks that you should track in the dashboard:
- Task Descriptions - Include a precise and succinct description of each task's requirements. This ensures everyone is on the same page and helps team members understand their roles.
- Assigned Team Members—To establish accountability and prevent confusion, assign each task to a single team member. This will allow team members to manage their workload more efficiently and set priorities.
- Due Dates - Setting deadlines for each activity makes it easier to accomplish projects on schedule. As a result, team members can properly organize their workloads and manage their time.
- Task Status Updates—Regular updates help team members stay informed and make informed decisions. They identify potential roadblocks or delays and allow for timely course correction.
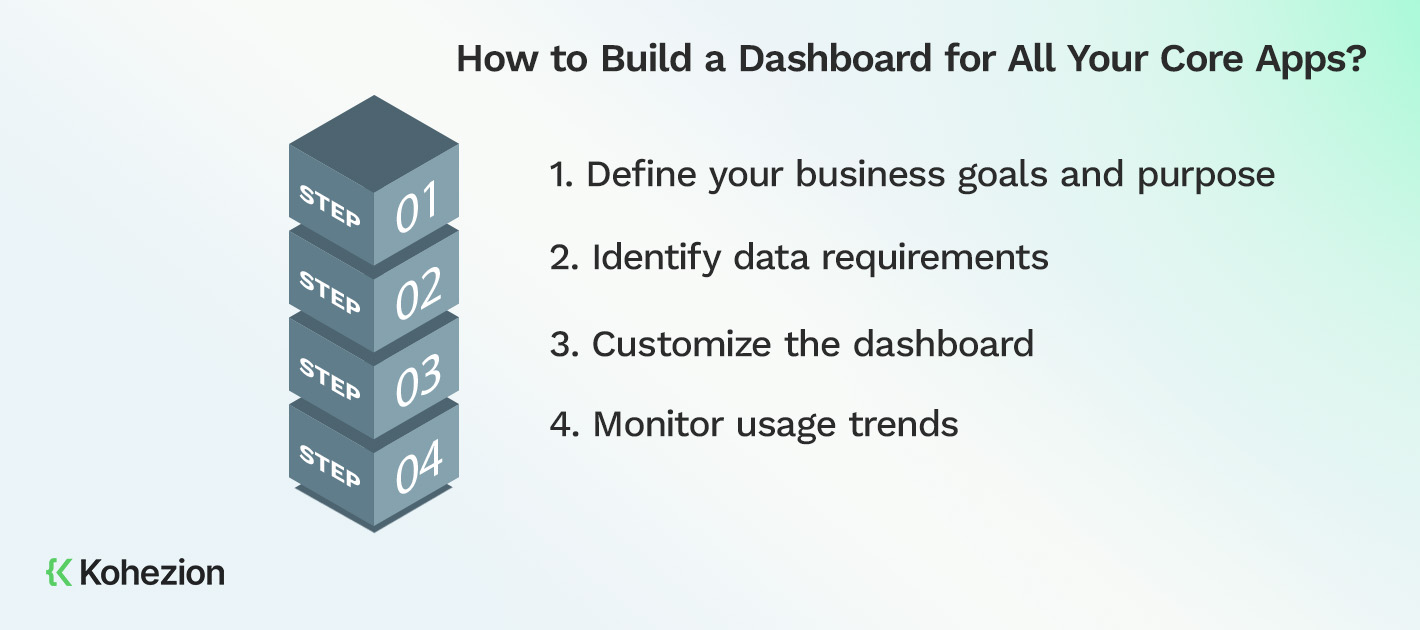
How to Build a Dashboard for All Your Core Apps
Building a dashboard for all your core apps can seem challenging, but it’s essential for streamlining your operations. Here’s a step-by-step guide to help you create an effective and comprehensive dashboard.
Step 1: Define your business goals and purpose
Defining the purpose of your dashboard ensures that it meets your goals. Business goals may include everything from increasing revenue and improving customer satisfaction to expanding your reach. Have a clear idea of the metrics to be monitored, like sales numbers, user engagement, or website traffic. Plus, know who will access and use the dashboard—managers, employees, or customers.
Step 2: Identify data requirements
Accurately identify the data required for the dashboard. Consider several considerations, including user roles, data sources, and data types. For example, there could be numerical, text-based, or visual data. Be sure to consider the different user roles using the apps. Also, determine where the data will come from and how it will be collected.
Step 3: Customize the dashboard
Choose the widgets most relevant to your business needs for a successful customization process. Also, arrange widgets logically that make sense for your business so you can quickly and easily find the information you need. Once you have configured widget settings, customize the dashboard to reflect your business's unique needs and priorities. Make sure it's tailored to your business goals.
Step 4: Monitor usage trends
The last step involves monitoring usage trends. Select the app or data you wish to monitor and go to the "Analytics" tab within the dashboard. Choose a specific date range or select the predefined options, such as last week, month, or year. Analyze the metrics to gain insights into user behavior and identify areas for improvement. Use the push notification feature to communicate with your users.
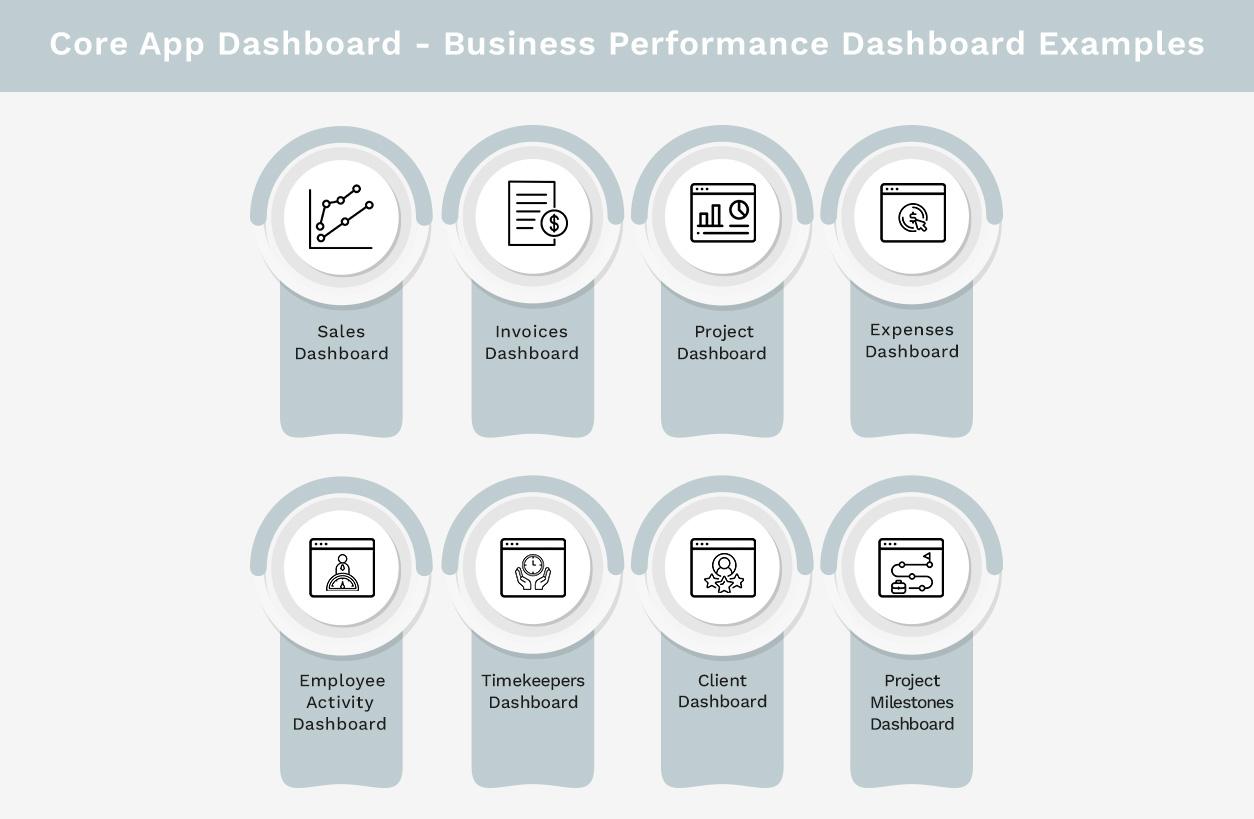
Core App Dashboard - Business Performance Dashboard Examples
Exploring examples of business performance dashboards can help illustrate the potential of a core app dashboard. Here are a few examples highlighting how different businesses utilize these tools to track and improve their performance.
1. Sales Dashboard
A sales dashboard is a visual tool that provides a comprehensive overview of key sales metrics and performance indicators, allowing businesses to track their progress towards targets and make informed decisions.
It typically includes data on sales volume, revenue, conversion rates, and sales pipeline stages, presented through charts, graphs, and tables for easy interpretation. The dashboard enables sales teams and managers to quickly assess their current status, identify trends, and address issues to optimize their sales strategies and improve overall performance.
2. Invoices Dashboard
An invoice dashboard plays a vital role in understanding a company's financial health. It offers a thorough review of the most important measurements, indicators, and practical information regarding billing and invoicing. The essential elements that must be present on an invoice dashboard are total revenue, invoice aging, and payment status.
Also, consider creating an invoice aging dashboard. It involves viewing overdue invoices, tracking payment history, and identifying trends in payment delays. Some tips and best practices for using the invoice aging dashboard effectively include setting up automatic alerts for overdue invoices, using the data to inform collection strategies, comparing A/R balances to monthly billings, and monitoring cash flow.
3. Project Dashboard
Project dashboards enable the monitoring of development and help maintain team cohesion. To create a project dashboard that integrates all your core apps, choose the right metrics that align with your business goals and objectives.
Next, organize the dashboard in a way that suits your business needs. Customize the dashboard by selecting specific data to display, renaming widgets, and applying filters to the data. Lastly, when sharing the dashboard with other team members, set permissions to control who can make changes.
4. Expenses Dashboard
Expenses dashboards are intended to help business owners and managers identify areas where cost-saving measures can be implemented. To design an effective dashboard for tracking expenses, start by organizing expenses into categories such as marketing, office supplies, and travel.
Include a widget that displays the amount spent in each category. Use a line chart to illustrate expense trends over time and incorporate a pie chart to show the distribution of expenses across different categories. Employ color coding and other visual cues to make the data easy to understand at a glance.
5. Employee Activity Dashboard
Ineffective employee behavior may result in poorer productivity, less satisfied customers, and, eventually, lower revenue. That's why businesses should create an employee activity dashboard with their core apps that let them monitor staff productivity, attendance, task completion rates, and other variables using this dashboard. These elements can be utilized to pinpoint problem areas and monitor staff performance.
6. Timekeepers Dashboard
To make sure the data is easily digestible, organize the dashboard in an ordered list that includes the following features and metrics time and expense entry summary, timesheet approval status, project summary, and expense summary.
Laid out the dashboard as an ordered list with distinct headings and subheadings for each widget to make this data simple to understand. Also, present the information in an aesthetically appealing way, like graphs or charts. It should have color coding to draw attention to any areas that need improvement.
7. Client Dashboard
Creating a client dashboard involves several essential features, such as client information, project milestones, progress updates, and financial information. The goal is to improve communication and transparency with clients.
To structure the client dashboard, start with a summary of the project's status and add detailed information on the project's progress. Ensure the dashboard is updated regularly to reflect any project status changes.
8. Project Milestones Dashboard
For businesses, keeping track of project milestones ensures that projects are finished on schedule, within budget, and to the satisfaction of all parties involved. Key features of the Project Milestones Dashboard include setting and tracking milestones, viewing progress and timelines, and assigning responsibilities.
The Project Milestones Dashboard aids companies in achieving their objectives by offering a clear perspective of project milestones. It solves the problem of tracking and managing project milestones.
Use Kohezion to Build Your Core App Dashboard
A relational database like Kohezion can simplify the process of building a core app dashboard. Kohezion allows you to organize and manage data efficiently, making it easy to pull relevant information from multiple sources into one central dashboard. Its user-friendly interface helps you create custom reports and visualizations without extensive technical knowledge. With Kohezion, you can track key metrics in real-time, ensuring you have the most accurate and up-to-date information to support your business decisions.
Conclusion
Core App Dashboard serves as that single source of truth, offering a robust solution for organizations seeking clarity, efficiency, and reliability in their data management. A relational database like Kohezion can improve data integrity and flexibility within the dashboard, making it the backbone of a seamless, well-organized system. It simplifies connections between data elements and improve the depth of insights from your information. The result is a dashboard that promotes data visualization and understanding.
For more information or to get started with Kohezion, contact us today.
Start building with a free account
Frequently Asked Questions
A single source of truth (SSOT) refers to a centralized repository where data is stored and managed in a consistent and accurate manner. A core app dashboard ensures all users access the same, up-to-date information, eliminating discrepancies and fostering informed decision-making.
A core app dashboard improves team collaboration by providing a unified view of data that all team members can access and understand. This transparency ensures everyone is on the same page, facilitates communication, and helps coordinate efforts towards common business goals.
A core app dashboard handles data from multiple sources through integration capabilities. It can connect with different databases, applications, and data streams, aggregating information into a cohesive and comprehensive view.
Security measures for a core app dashboard typically include data encryption, user authentication and authorization, regular security audits, and compliance with industry standards and regulations to protect sensitive business information.