A Business Intelligence (BI) Dashboard is a tool that offers a visual representation of key data points to help businesses analyze trends, track performance, and identify growth opportunities. This post explores what a BI Dashboard is and why it is important. It also provides step-by-step instructions on how to build your own.
We'll buid your first application for you. At no extra cost.
Let us build your first business application for free. Go from an idea to an application in under 2 weeks.

What Is a Business Intelligence Dashboard?
A Business Intelligence Dashboard is a tool that distills complex data into visual formats like charts, graphs, and tables for easier interpretation and analysis. It presents the most relevant information to stakeholders from a single interface.
These dashboards are customizable to ensure that the insights you need are prominent and accessible. A BI Dashboard aligns your data, regardless of whether you're monitoring sales figures, tracking customer behavior, or keeping an eye on operational efficiency, so you can quickly pivot from observation to action.
The value of the Business Intelligence market is expected to increase to $33.2 billion by 2025, growing at a 7.6% annual growth rate. One of the main drivers behind this growth is the increased demand for dashboards and other data visualizations.
What Purpose Does a BI Have?
A BI Dashboard gives business users a quick and comprehensive view of their data. It simplifies complex analyses of large datasets and reveals trends and patterns that may otherwise go unnoticed in raw data.
BI Dashboards organize information cohesively and apply advanced intelligence tools to eliminate guesswork in strategic business operations, ensuring your data's potential is fully realized.

Features and Components of a Business Intelligence Dashboard
Below, we break down the essential features and components that make up a BI Dashboard.
- Data Source Connections: BI Dashboards gather information from diverse sources for a complete view of organizational metrics. Whether the data resides in AWS, third-party clouds, on-premises, or in a complex ecosystem of all three, BI tools funnel it into one centralized point for analysis.
- Data Connectors and Integration:Data connectors and integration technologies ensure that the dashboards are consistently updated with the latest data inputs from across the entire data estate. With these connections, businesses can combine different datasets to create a comprehensive platform for data exploration.
- Visual Representations of Data: Visual representations use bar charts, line graphs, heat maps, and gauges to make complex data understandable even to the non-technical user. This visual transformation of data helps quickly convey key insights, regardless of whether you track progress towards goals or identify anomalies.
- Tabulated Data Displays: Tabulated data displays provide a structured and detailed snapshot of your data in rows and columns for easy sorting and comparison. These tables might have advanced features like color coding and conditional formatting highlighting key figures and trends. This display option is especially useful when you need to drill into the specifics, like comparing sales numbers across different regions or examining the particulars of inventory levels.
- Drill-Down Functionality: Drill-down capabilities turn a static data display into an interactive experience to uncover more detail behind the summarized information. This functionality helps break down a holistic view into specific, actionable insights without switching between multiple reports or platforms. For example, if you click on a bar representing regional sales, you can see data by individual cities.
- Data Filtering: Data filtering allows you to sift through vast datasets to pinpoint the data that matters most. You can set different parameters, such as time periods, departments, or product lines to tailor your view. This customization is valuable when you want to focus on particular areas without being overwhelmed by irrelevant information.
- Text Boxes and Pop-Up Tooltips: Text boxes and tooltips offer contextual information and guidance. Text boxes provide explanatory narratives or insights, directing attention to what's important on the dashboard. Tooltips appear when you hover over a data element. They give instant access to additional details without cluttering the visual space. These features improve user understanding and the dashboard's utility.

BI Dashboards vs. BI Reports
Both BI Dashboards and BI Reports are important in business intelligence strategies but have different purposes. Dashboards are dynamic and interactive, designed for at-a-glance monitoring and quick insights. They often operate in near real-time and support interactivity, like drilling down or filtering data.
BI reports are more static and detailed documents created for in-depth analysis. They're ideal when you need to digest and discuss the finer points of business data, often in scheduled intervals rather than on the fly.
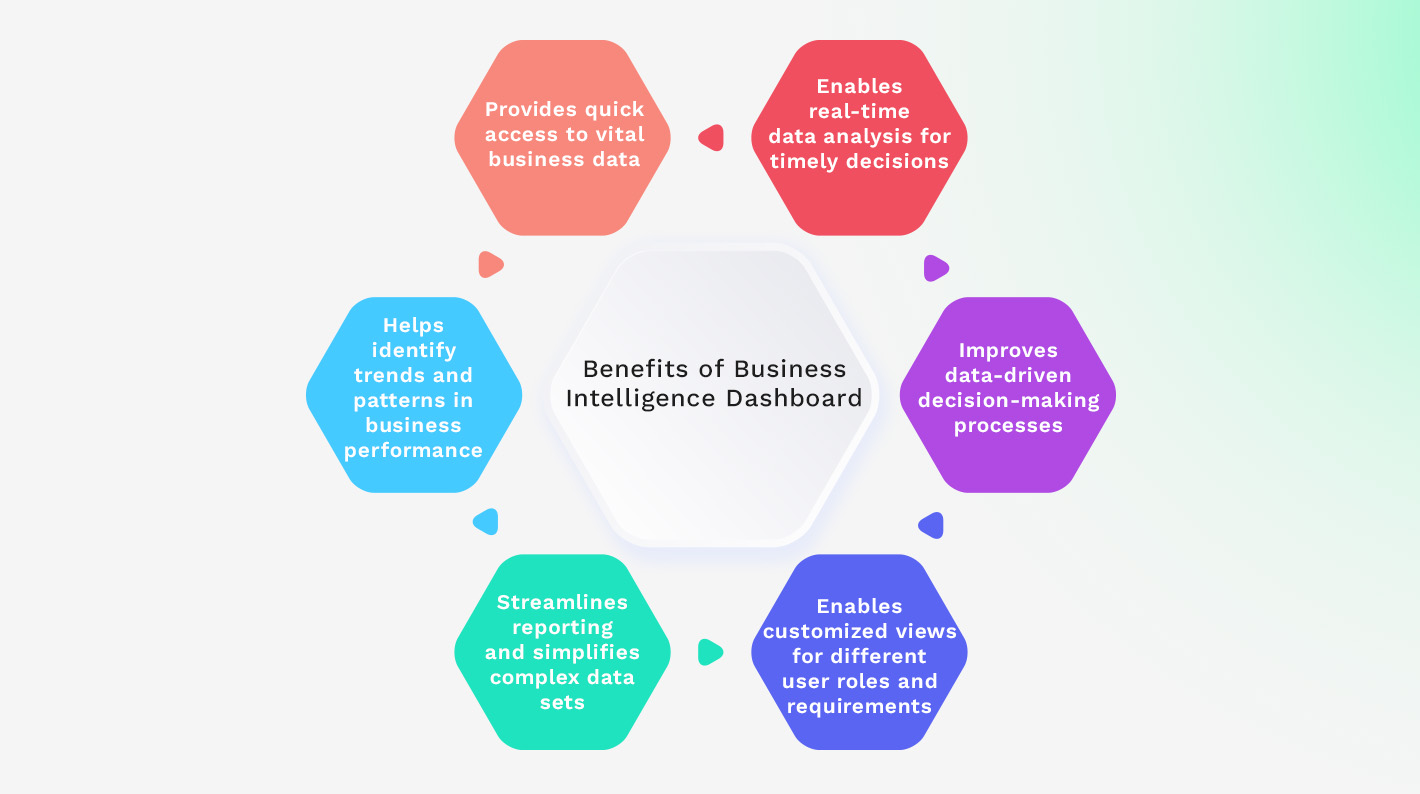
Benefits of Business Intelligence Dashboard
A Business Intelligence Dashboard has many benefits. It gives a clear view of important metrics and helps with data-based decisions. In this list, we'll look at the advantages BI Dashboards offer to all types of organizations.
Provides quick access to vital business data
A BI Dashboard is a single point of entry to business data, enabling quick information access without extensive searching or analysis. This immediacy saves time and supports agile decision-making.
Enables real-time data analysis for timely decisions
BI Dashboards enable real-time data analysis for quick and informed decision-making. This aspect of BI dashboards helps manage time-sensitive issues and capitalize on opportunities before they pass, keeping you ahead of the market curve.
Helps identify trends and patterns in business performance
Identifying trends and patterns through a BI Dashboard can help recognize potential growth areas, warning signals, or consumer behavior shifts. These insights can guide strategic planning and actions to drive your business toward success.
Improves data-driven decision-making processes
BI Dashboards present data in a digestible and interactive format, enabling a decision-making process based on factual insights rather than intuition alone.
Streamlines reporting and simplifies complex data sets
BI Dashboards automate the collection and presentation of complex data sets to streamline the reporting process. Instead of going through spreadsheets or databases, users can access curated data in an easily understandable format. This simplification allows users to focus on analysis and action rather than data compilation.
Enables customized views for different user roles and requirements
BI Dashboards provide customized views tailored to different users' specific roles and requirements. For example, a marketing team might focus on customer engagement metrics, while finance teams concentrate on cash flow analysis. Customizable dashboards allow each department to have a version that resonates with their objectives, resulting in better alignment across the company.
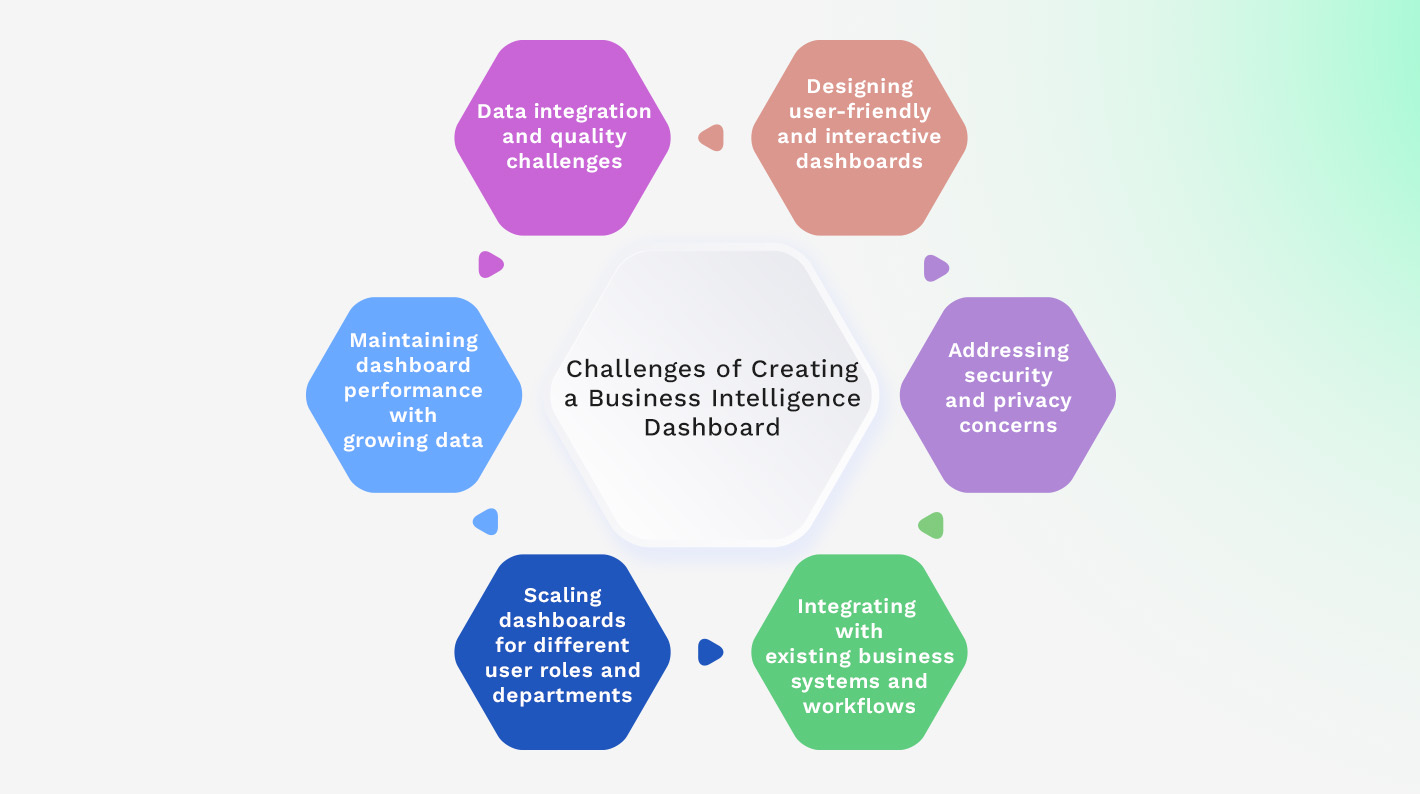
Challenges of Creating a Business Intelligence Dashboard
BI Dashboards have many advantages, but they also come with certain challenges. Below, we'll look at some common obstacles organizations might have when creating and using a BI Dashboard.
Data integration and quality challenges
One of the main challenges in creating a BI Dashboard is ensuring that data from diverse sources is integrated and of high quality. Without quality data, the insights could be misleading or incomplete. Robust data governance policies and state-of-the-art integration tools can overcome this obstacle.
Designing user-friendly and interactive dashboards
Designing user-friendly and interactive dashboards catering to diverse user needs can be challenging. The goal is to create an intuitive and engaging interface that simplifies the user's interaction with complex data sets. This involves a keen eye for design aesthetics, an understanding of user experience principles, and the ability to anticipate user requirements. Striking the right balance between functionality and simplicity ensures that the BI Dashboard will be widely adopted within the organization.
Maintaining dashboard performance with growing data
As the volume of data grows, so does the strain on a BI Dashboard's performance. Ensuring that your dashboard scales effectively and delivers prompt, accurate information without lag can be a significant technical hurdle. It involves optimizing data storage, streamlining data processing, and choosing a robust BI platform capable of handling increased loads. Continuous performance monitoring and upgrades help maintain the speed and reliability that users expect from their dashboard tools.

Addressing security and privacy concerns
Security and privacy concerns are paramount when creating a BI Dashboard, considering the sensitive nature of the data involved. Incorporating end-to-end encryption, rigorous access controls, and compliance with data protection regulations like GDPR or HIPAA is essential. Training users to understand and comply with security protocols is as important as the software used to enforce them.
Scaling dashboards for different user roles and departments
The dashboard must be flexible enough to provide specific, role-based access and insights while maintaining a coherent structure. Tailoring content and controls requires a deep understanding of each group's data needs and careful planning to ensure that the right metrics and dashboards are visible to the right users.
Integrating with existing business systems and workflows
Integrating a BI Dashboard within existing business systems and workflows ensures seamless operation and user adoption. This may include synchronization with CRM, ERP, and other enterprise systems. It requires a flexible design that accommodates unique organizational infrastructures and future changes.
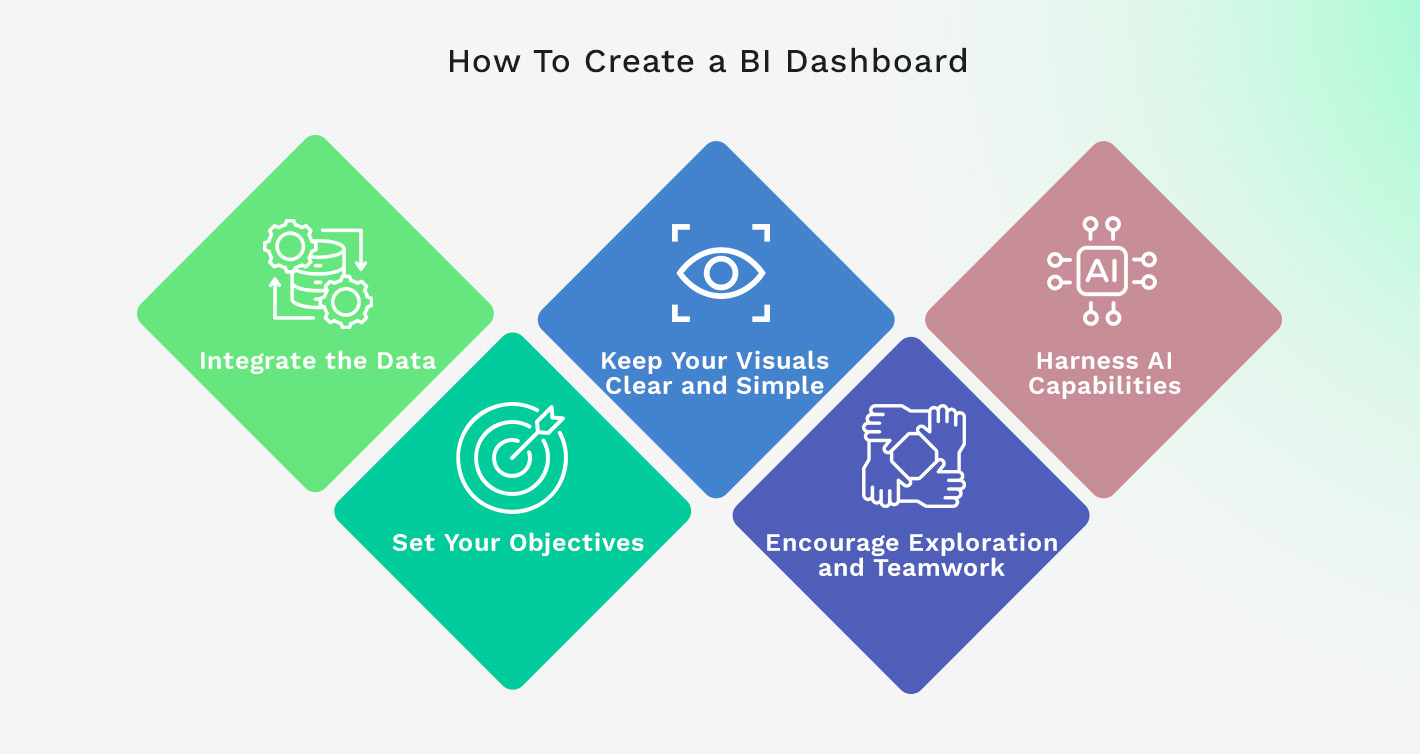
How To Create a BI Dashboard
In this section, we'll outline the steps for building your business's dashboard.
Integrate the Data
The first step is to integrate your data from all available sources. This means establishing connections to databases, cloud services, applications, and other repositories where pertinent data is stored. Aim for a comprehensive approach where sales figures, customer data, operational stats, and financial records come together seamlessly. The goal is to create a unified dataset that shows a 360-degree view of your business.
Set Your Objectives
Define what you want to achieve with your dashboard. It could be improving sales, increasing customer satisfaction, or streamlining operations. Set SMART (Specific, Measurable, Achievable, Relevant, and Time-bound) goals. This clarity will guide the design of your dashboard to ensure that every metric and data visualization is aligned with your strategic business outcomes.
Keep Your Visuals Clear and Simple
Stick to one color scheme for a coherent look, and avoid overloading your dashboard with too many charts or metrics. The goal is to communicate information quickly and clearly. Embrace white space and remove nonessential elements like unnecessary gridlines or labels. If your visuals are cluttered, they're likely to become more of a distraction than a tool for insight.
Encourage Exploration and Teamwork
Designing with interactivity in mind encourages users to explore the data, ask questions, and discover insights cooperatively. Empower your team to filter, sort, and drill down into specifics. Also, makes sharing insights easy to promote collaboration across departments. A dashboard that is a hub for collective data exploration strengthens the team's ability to create informed, unified strategies.
Harness AI Capabilities
Leverage AI capabilities to improve data analysis, automate complex processes, and predict trends based on historical data. AI can provide natural language processing for easy querying or generate insights without manual intervention. This reduces the need for routine data processing, resulting in improved dashboard intelligence and more time for strategic tasks.
BI Dashboard Examples and Use Cases
Below, we explore examples of how businesses across different industries are using BI Dashboards to gain insights, make informed decisions, and drive success. From sales analytics to financial reporting, these examples showcase the versatility and effectiveness of BI Dashboards in solving business challenges and achieving goals.
IT dashboards
IT dashboards provide a real-time snapshot of an organization's IT health. They help track crucial analytics about networks, databases, and applications, highlighting performance issues, potential security threats, and tech-related costs. This targeted data visualization tool supports IT professionals in proactive monitoring and quick troubleshooting, contributing to the stability and efficiency of technology within the business.
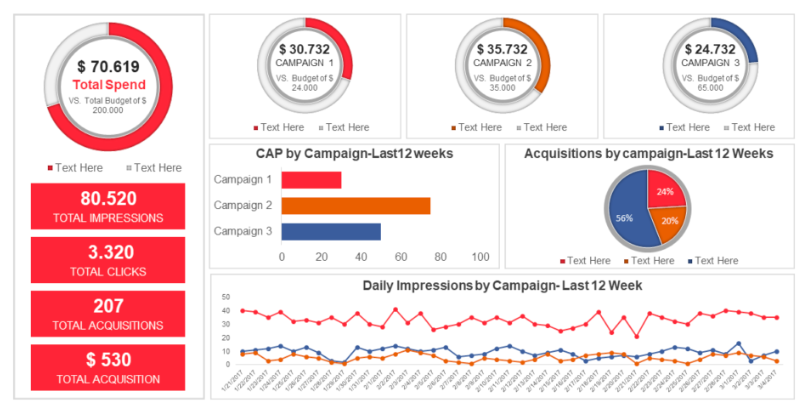
Sales and marketing dashboards
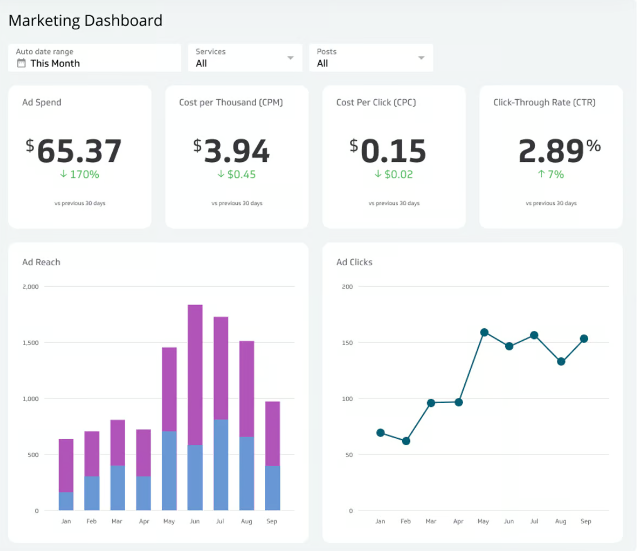
Sales and marketing dashboards provide a detailed view of critical metrics such as lead conversion rates, sales cycle lengths, and customer acquisition costs. Monitoring these KPIs allows businesses to fine-tune their strategies in real-time and ensure that their marketing and efforts bring maximum returns. They also foster alignment between sales and marketing teams, uniting them around shared objectives.
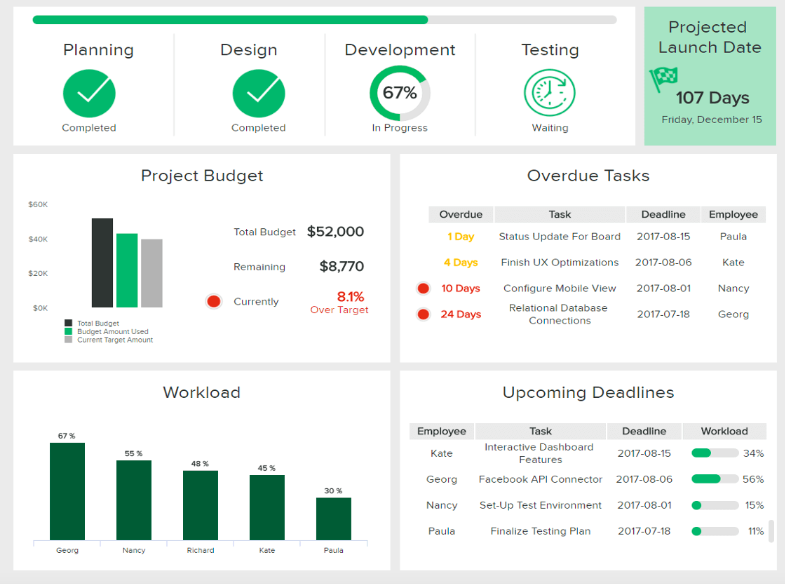
Project dashboards
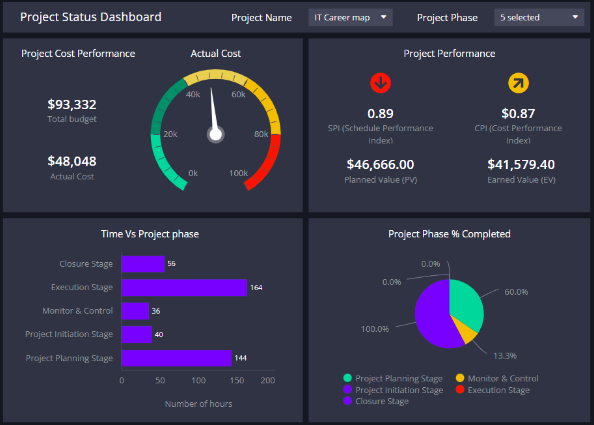
Project dashboards show all project-related metrics and provide instant visibility into the status and progress. They allow project managers and team members to monitor deadlines, budgets, resources, and milestones at a glance. With a project dashboard, teams can identify potential bottlenecks early, ensure resources are allocated efficiently, and keep projects on track, improving project management effectiveness.
Human resource dashboards
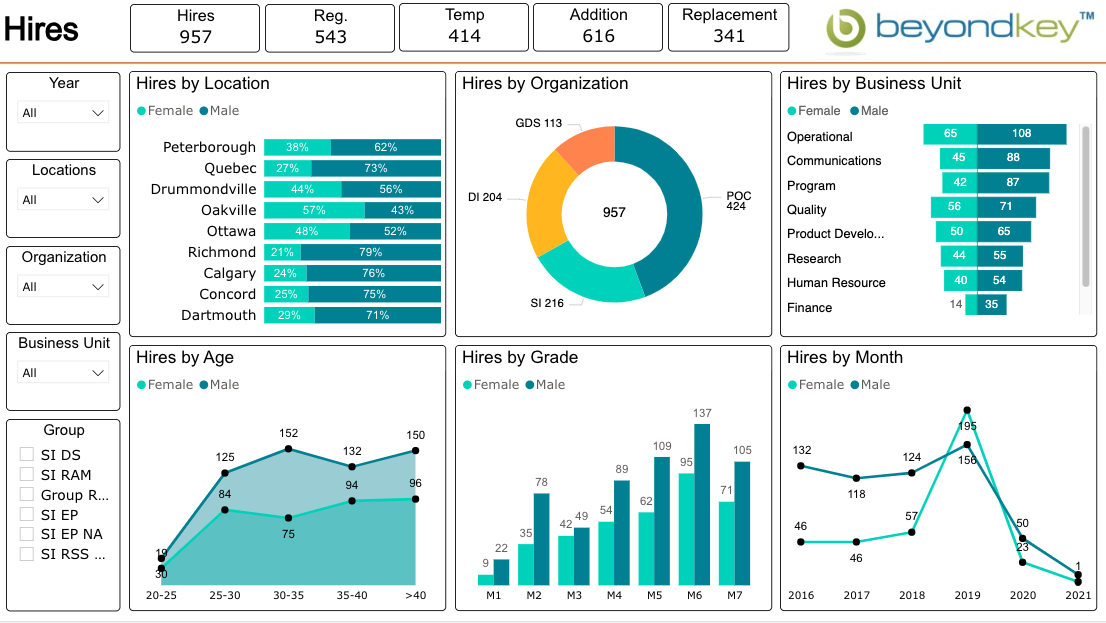
HR dashboards visualize recruitment trends, employee turnover, performance evaluations, and training progress. These dashboards support HR professionals in making evidence-based decisions to improve hiring practices, promote employee development, and maintain a healthy work environment, contributing to the company's culture and success.
Customer dashboards
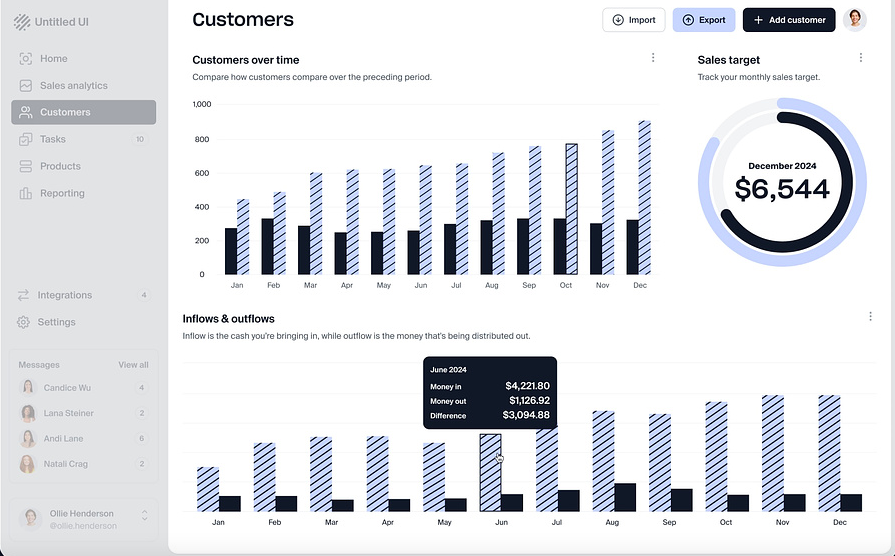
Customer dashboards track customer behavior, satisfaction, and retention levels. These insights help businesses tailor customer service strategies, nurture customer relationships, and increase loyalty. They monitor aspects like Net Promoter Scores, support ticket volumes, and customer journey analytics to help companies adapt to evolving customer needs and stay competitive.
Operational dashboards
Operational dashboards present real-time data on operational efficiency, such as productivity per team or employee, error rates, and inventory levels. These dashboards help managers make quick, evidence-based adjustments to day-to-day operations. With a clear view of essential operational metrics, businesses can optimize processes, manage supply chains effectively, and improve performance.
Financial dashboards
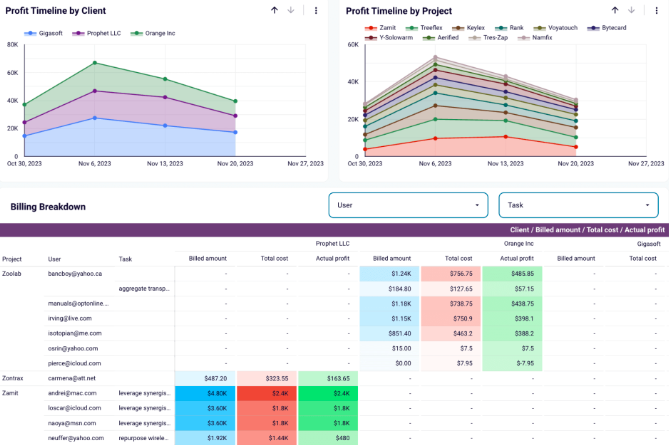
Financial dashboards provide a strategic overview of an organization's fiscal health and performance, which is essential for daily management and long-term planning. They display cash flow, revenue breakdowns, and profitability metrics to help stakeholders make informed financial decisions.
Mobile dashboards
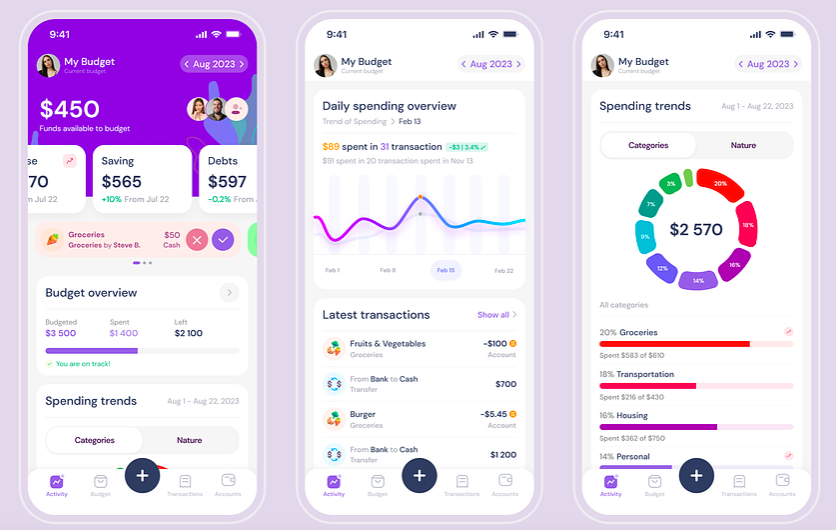
Mobile dashboards extend the power and convenience of BI to your mobile device, ensuring access to data anytime, anywhere. They're tailored for on-the-go decision-making, with responsive design that maintains functionality across smartphones and tablets. These dashboards empower a modern workforce to stay informed and responsive to real-time business conditions, fostering a highly connected and agile business environment.
Create Your Business Intelligence Dashboard with Kohezion
Creating your Business Intelligence Dashboard is more accessible than ever with Kohezion. This powerful online database software offers a user-friendly platform to design custom BI Dashboards tailored to your business needs.
With Kohezion, your data is visible and operational, thanks to its drag-and-drop interface and customizable templates. You can shape data visualizations, set up automated actions, and share insights across your team without any programming skills.
Leverage Kohezion to unlock the narrative your data has been waiting to tell and drive your business to new heights.
Conclusion
Creating and using a Business Intelligence Dashboard can revolutionize how you interact with data. BI Dashboards offer many benefits tailored to your business's unique needs, from improved decision-making to fostering greater collaboration across departments.
Now that you have the knowledge and tools at your fingertips with platforms like Kohezion, you can create a dashboard that works for you and your team, is easy to use, and delivers value to your organization.
Start building with a free account
Frequently Asked Questions
You can integrate a wide variety of data into a BI dashboard, including sales figures, customer data, financial metrics, operational statistics, and more. The data you choose should align with your business goals and decision-making needs.
Determining the right metrics for your BI dashboard involves understanding your business objectives and the decisions the data needs to support. Consult with stakeholders across departments to ensure the metrics are relevant, actionable, and aligned with strategic goals.
You can use various tools and software to create a BI Dashboard, including Kohezion, Tableau, Microsoft Power BI, Qlik, SAP, and Salesforce's Tableau. They vary in complexity and features, so choose one that suits your business needs and user expertise.
Use encryption, set strict access controls, and comply with data protection laws to ensure data security and privacy within a BI Dashboard. Regular security audits and user training also help safeguard your data.
Update your BI Dashboard as frequently as your business needs it, which could range from real-time updates for high-pace decisions to daily or weekly for regular monitoring. Choose a cadence that ensures data is current and reliable.
Measure the success of a BI Dashboard by its adoption rate, user satisfaction, and whether it aids in faster, data-driven decisions. Track if it’s meeting the defined objectives and delivering ROI.
Users of a BI Dashboard may need training on interpreting data visualizations, navigating the dashboard, and understanding metrics. Ongoing support includes help desks, tutorials, and updates on new features.